The CSV Export add-on for Tickera is easy to overlook because it sounds simple: export attendee data to a CSV file. But for event organizers, that file can become a practical reporting, operations, and marketing tool.
With the right columns and a few spreadsheet formulas, you can count check-ins, compare gates, review sales, segment attendees, prepare email campaigns, and spot operational patterns after the event.
Short version: export the right attendee fields, open the CSV in Google Sheets or Excel, then use simple formulas like COUNTIF, COUNTIFS, SUM, and filters to turn ticket data into decisions.
Start With the Right CSV Fields
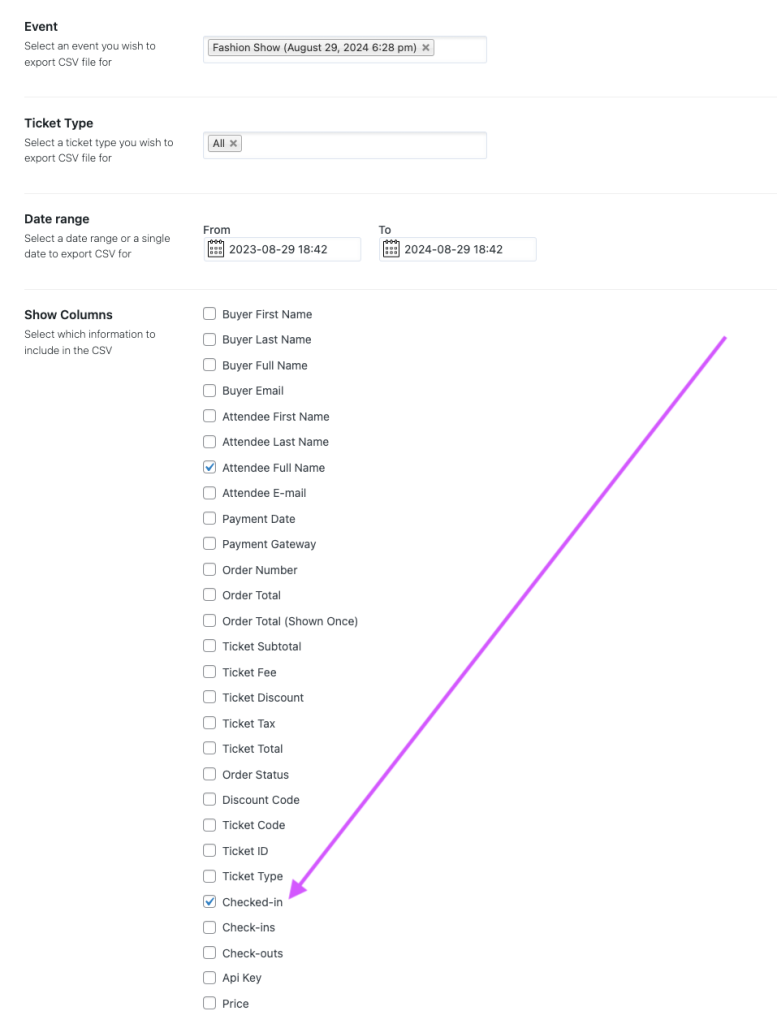
Before you export, decide what question you want to answer. A clean report starts with the right columns. For most event reports, include attendee name, email, ticket type, order status, checked-in status, check-in date or time, gate or API key if available, and price or order value if you need revenue analysis.
For the examples below, we are using Google Sheets because it is free and easy to access. The same general formulas also work in Microsoft Excel, Apple Numbers, OpenOffice Calc, and similar spreadsheet tools.
Count Checked-In Attendees
One of the most useful reports is also one of the simplest: how many attendees actually checked in?
If your exported CSV includes a column named “Checked-in” with values such as Yes and No, you can count checked-in attendees with COUNTIF. In this example, column B contains the checked-in status:
=COUNTIF(B2:B100, "Yes")To count attendees who did not check in, use the same formula with “No”:
=COUNTIF(B2:B100, "No")
This gives you a quick attendance number, but it also opens the door to more useful comparisons: check-ins by ticket type, gate, time window, or campaign source.
Count Check-Ins by Gate
If your event uses multiple entrances or multiple API keys for check-in, CSV data can show how traffic was distributed. That helps you understand whether one gate was overloaded while another was underused.
Assume column B contains “Checked-in” and column C contains the gate name or API key. To count checked-in attendees at Gate A, use COUNTIFS:
=COUNTIFS(B2:B100, "Yes", C2:C100, "Gate A")Repeat the formula for Gate B, Gate C, and any other entrance. This is especially useful when you are improving your Checkinera check-in flow for the next event.
| Metric | Formula idea | Why it helps |
|---|---|---|
| Total checked in | COUNTIF | Shows actual attendance. |
| Not checked in | COUNTIF | Shows no-shows or unused tickets. |
| Check-ins by gate | COUNTIFS | Shows entrance load distribution. |
| Check-ins by ticket type | COUNTIFS | Shows how different attendee groups arrived. |
| Revenue by ticket type | SUMIF or pivot table | Shows which tickets generated the most revenue. |
Analyze Ticket Sales and Revenue
CSV exports are also useful before and after the event for sales analysis. You can review which ticket types sold fastest, which generated the most revenue, and where pricing could be improved next time.
If column D contains ticket type and column E contains ticket price or order value, you can sum revenue for a specific ticket type with SUMIF:
=SUMIF(D2:D100, "VIP", E2:E100)You can also create a pivot table to group revenue by ticket type automatically. This is often easier for larger events because it avoids maintaining many separate formulas.
If the numbers show that one ticket type consistently underperforms or sells out too quickly, use that insight when planning your next event ticket pricing strategy.
Build Better Email Segments
Attendee data can also support smarter communication. Instead of sending the same message to everyone, you can segment your export by ticket type, attendance status, purchase date, or attendee category.
- Email checked-in attendees with a thank-you message and feedback survey.
- Email no-shows with a recording, recap, or next-event offer where appropriate.
- Send VIP attendees premium follow-up content or early access to the next event.
- Send local attendees different travel or venue information than remote attendees.
Be careful with privacy and consent. Exported attendee data should be used responsibly and in line with your privacy policy, local regulations, and the permissions attendees gave during checkout.
Use Filters to Find Operational Issues
Sometimes the best insights come from filtering rather than formulas. Sort or filter your CSV to find patterns that affected the event experience.
- Filter by unpaid, cancelled, refunded, or failed orders before check-in.
- Filter by ticket type to prepare entrance instructions.
- Sort by purchase date to understand early-bird vs last-minute buyers.
- Filter by custom attendee fields such as meal choice, workshop track, or company.
These small reports can help you improve event communication, staffing, pricing, and check-in planning without adding a complicated analytics tool.
CSV Export Checklist
- Decide what question the export should answer.
- Include attendee, ticket, order, checked-in, and gate fields where relevant.
- Open the CSV in Google Sheets, Excel, or another spreadsheet app.
- Use COUNTIF for simple Yes/No counts.
- Use COUNTIFS when you need multiple conditions.
- Use SUMIF or pivot tables for revenue by ticket type.
- Save reusable templates so future event reports are faster.
Frequently Asked Questions
Can I use CSV Export with Google Sheets?
Yes. Export the CSV from Tickera, upload or open it in Google Sheets, and then use formulas, filters, and pivot tables to analyze attendee and ticket data.
What formula counts checked-in attendees?
If the checked-in status is in column B, use =COUNTIF(B2:B100, "Yes"). Adjust the range to match the number of rows in your export.
Can CSV Export help with post-event marketing?
Yes, if you use attendee data responsibly. You can segment attendees by ticket type, attendance status, or other exported fields, then send more relevant follow-up messages where you have permission to do so.
Final Thoughts
CSV Export is more than a way to download attendee lists. It is a practical reporting tool for understanding what happened before, during, and after your event.
When you export the right fields and use a few spreadsheet formulas, you can measure attendance, compare gate performance, review revenue, improve communication, and make better decisions for the next event.